Debugging problems in GD Script code

Posted on March 21st, 2022
Let’s look at some handy techniques for troubleshooting issues in your game’s GDScript code. Whether you are getting strange behavior, weird errors, or the game straight up isn’t doing anything, I hope this post will give you some pointers on getting to the bottom of code problems in Godot.
These tips start simple and get more complex as we go. Let’s get started!
Tip 1: Print variable values to the Output console
We’re starting basic here, but this tip is a critical building block of troubleshooting any programming language. It’s the first thing I reach for when learning a new engine, framework, or library… printing values to a console during runtime.
print in Godot will take in a value, whether it is hardcoded or pulled from a variable, and plop it in the Output console. If you are coming from JavaScript, this is just like console.log. This is useful for making sure a variable’s value is getting set to what you expect. It’s also nice for making sure an area of code is actually executing.
func _ready():
	print("Hello!") #prints Hello

	var a = 1;
	var b = 2;
	var c = a+b;
	print(c); #Prints 3
Here’s a screenshot of the Output tab in Godot. You can find it towards the bottom of your Godot IDE window.
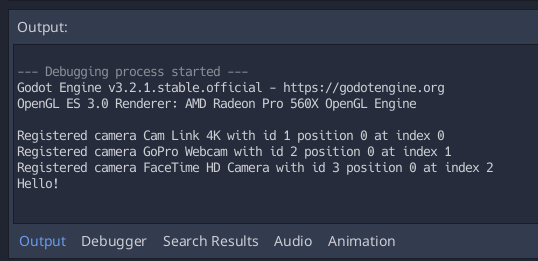
Printing is handy, but you can see that the output doesn’t have a lot of context. It’s just the value all by itself. Like, “Hello”.
This is okay when only a few print lines are firing, but it can be hard to read when there are many logs happening throughout a project… or if a log is happening many times. It’s easy to lose track of what is what.
Powering up the printed message with more information can help increase readability. Godot strings have a method called .format that can be used to inject values into string content. Again, if you are coming from JavaScript, it’s a little bit ES6 template literals. Utilizing this method can make print messages easier to read.
	func _ready():
		print("Score: {score}".format({"score": score})
		# Prints 'Score: 200'
		# ^^ This message is a little nicer to read than just `200`
It usually makes sense to remove print lines after you’re done reading them. Otherwise, the Output console will quickly get noisy as the project grows. There are times where it makes sense to keep print lines around, maybe in places that are often referenced… or for alerting of edge cases that may appear as you work on other parts of the game.
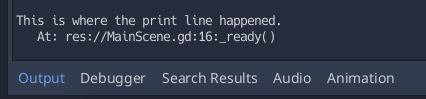
In these cases, a special flavor of print can be used: print_debug. This command will print the value just as before, but also include the file and line number of the function call. This helps quickly track down where the log is happening.
Godot’s documentation covers the different variations of print. Check them out here.
Tip 2: Use the Debugger
Godot’s built in Debugger is top notch… definitely one of my favorite IDE debugging experiences in any editor I’ve used before. Learning to use the Debugger will enable you to quickly navigate logic problems in your game’s code.
Godot’s Debugger is always watching for Breakpoints in our game’s code during execution. GDScript gets executed line by line, one at at a time. When one of those lines contains a Breakpoint, Godot will stop execution and give us a chance to look around before proceeding. It feels like being in The Matrix when characters stop time and do the cool ninja jump.
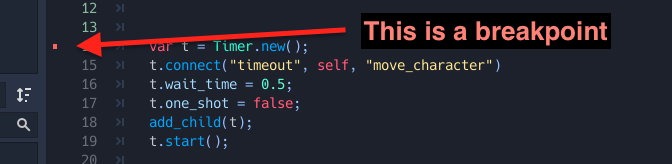
To add a Breakpoint, click just beyond the left side a line number in Godot’s Script editor. You’ll see a red dot appear on the line. Here’s a screenshot:
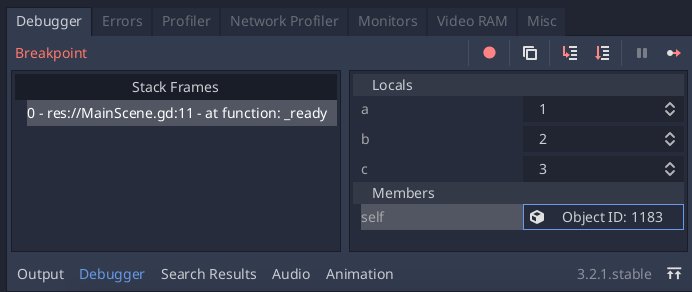
Run the code and you’ll notice the engine pauses on the Breakpoint line.
While the code is paused, you can pop over to the Debugger panel and read the values of all relevant variables and Nodes. The panel even divides out local, member, and global variables. In many cases, you can live edit the values right here. They will instantly update in the actual running game!
While paused, the debugger gives you a few tools to use to navigate through code. Here’s a breakdown of the tools:
 Step Into (F11). This button will execute the current line of code, then jump and pause on the very next line of code that will happen. If this line of code executes a function call, for example, the Debugger will warp you inside that next actual function so you can step through everything it does. This "one step at a time" approach is great for navigating complex multi-function logic journeys.
 Step Over (F10). Similar to Step Into, but the execution will simply fast-forward through external function calls. This is handy for keeping the debugger focused on the current method and is also less disorienting. If you are certain an issue is happening inside the method that the Debugger is paused in, this button is the way to go.
 Continue (F12). This button simply resumes the normal execution of code. The game will continue to run as normal until it finds another Breakpoint.
 Skip Breakpoints. This toggle temporarily disables Breakpoints. When a lot of Breakpoints are sprinkled through the code, you may find yourself wanting to run the game as normal without needing to remove all of those Breakpoints. Maybe you need them again in a second. Sometimes it is handy to leave them around.
Breakpoints and the Debugger are very effective for stepping through complex logic. While the controls take some practice, embracing them may speed up your workflow.
Tip 3: Check for Errors and Warnings
Sometimes our code will run without crashing the game in runtime errors, but our expected result still does not occur. It feels like the code is silently ignoring what you want it to do. After double and triple checking that everything is named and spelled correctly, it may be time to look in the Warnings tab.
The Errors tab provides feedback for (you guessed it) Warnings and Errors. These areas of feedback can be found in the Errors tab:
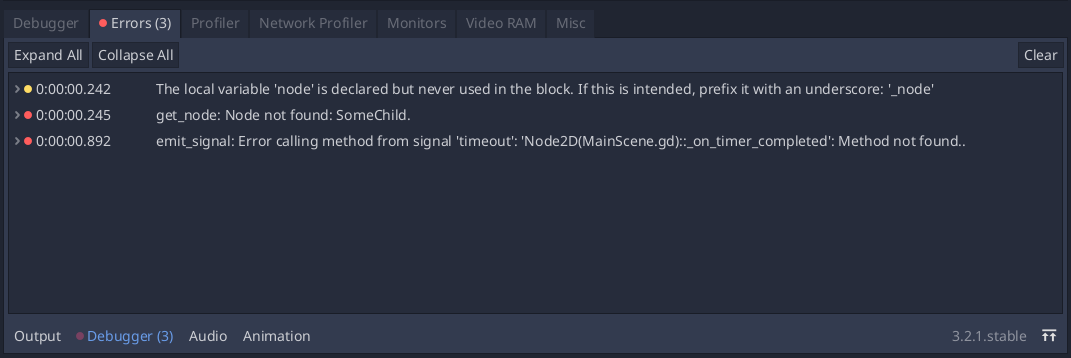
Warnings are in yellow. They often call out linting or formatting issues and provide tips for correcting them. You can configure the pickiness of Warning messages in Project Settings under Debug/Gdscript.
Errors shows up in red. They are a bit more serious. Perhaps the code tried to access a node, but the node wasn’t there. Well, that was an extra bit of unnecessary work that the engine had to do… so Godot is upset about it. That’s an Error.
Maybe we tried to connect a method to a signal, but the wrong number of arguments were declared in the method signature. Godot doesn’t like that, either… the connected method will never fire. I’ve spent many hours trying to debug why a connected signal wasn’t firing. This feedback quietly shows up as an Error in the tab. The Errors tab would have told me the problem right away.
The Error tab also calls out how many total pieces of feedback have been logged. This number will probably grow as you build and play through your game, so keep an eye on it and address issues as they occur.
Tip 4: Remote Inspect
Finally, when things are truly off the rails, Godot’s Remote Inspect feature is here to save the day. Remote Inspect allows you to dig through the Scene tree of your currently running game. Start your game or Scene, click Remote, now you will see the full content of your currently running game.
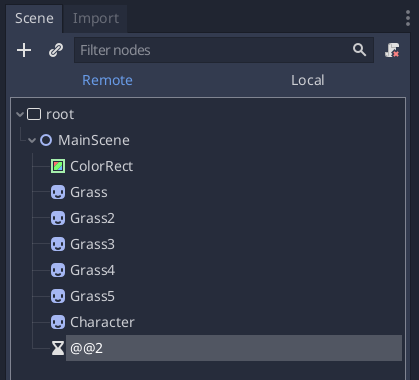
The Remote tab is great for verifying all nodes are present and nested in their expected order. For example, maybe a script is creating and nesting child Nodes within a specific parent on the fly. The Remote Tab will tell us if the children are actually landing in the correct layer, along with their actual names and information. The Remote Scene Tree looks and behaves just like the normal Node creation and development experience.
This tool is also nice for investigating visual problems. For example, if we add a node to the scene but don’t see it, it’s possible the node is present but outside of my Camera viewport. Maybe the position was set horribly wrong. In these cases, we can pop open the Remote tab, find the relevant node, and tweak the position.
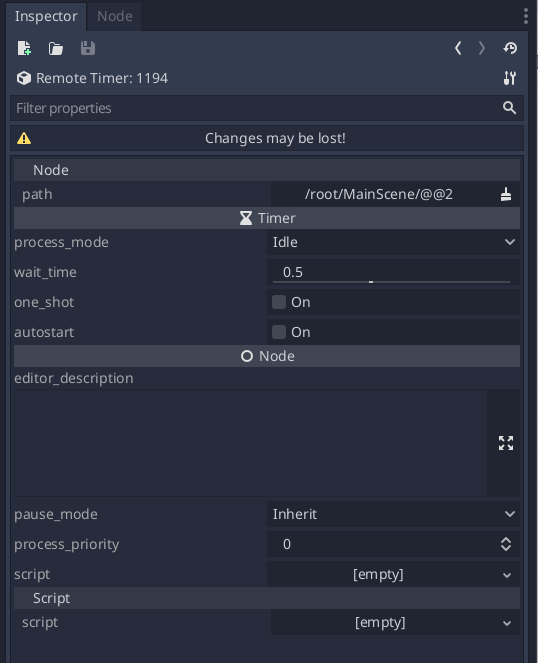
Similar to tweaking values with the Debugger, edits in the Remote Tab instantly appear live in the game window. It’s handy for quickly prototyping positions, layering, and values without needing to start and stop the game between edits.
That’s all for now!
These four concepts pretty much cover all of my troubleshooting strategies in GDScript. For more detail, here’s a screenshare video in which I show the techniques in action:
If you have comments, questions, or tips of your own, feel free to email me or join us on Discord.
Previous Post